Grade Curve Calculator
A grade curve calculator takes a set of raw scores and adjusts them upward to a fairer or more useful distribution. Enter your scores, pick a curving method — a flat curve, a square root curve, a bell curve, or a standard-deviation method — and the tool computes the curved grade for each student in one step. It’s the fastest way to see what a curve actually does to a score before you commit to it.
Teachers and professors reach for it when an exam turns out harder than intended and the raw results don’t reflect what students learned. Students use it to estimate where their adjusted score lands once a curve is applied. Either way, the calculator handles the statistics — mean, standard deviation, and the rest — so you don’t have to work the distribution by hand.
Grade Curve Calculator
Apply a curve to a raw score and see the adjusted result.
Enter a raw score and a value above to see the curved result.
How grade curves work
Curving adjusts raw scores upward using a consistent rule. This tool supports the three most common methods, so you can match whatever your instructor used.
curved = raw + pointsCurve to highest:
curved = raw + (100 − class high)Square root:
curved = √raw × 10Example: with a square-root curve, a raw 64 becomes √64 × 10 = 80. Results are capped at 100.
Curving raises raw scores using a fixed rule — adding points, lifting everyone so the top score becomes 100, or applying a square-root formula.
Each raw score is replaced by its square root times ten, so lower scores rise more than high ones. A 64 becomes 80; an 81 becomes 90.
The class’s top score is treated as 100 and the same number of points is added to everyone. If the high was 92, each score gains 8 points.
How to Use the Grade Curve Calculator
- Enter the scores. Add a single raw score plus the class average, or paste the full set of class scores and let the tool compute the statistics for you.
- Choose a curve method. Select a flat curve, proportional scaling, bell curve, square root curve, or the z-score method, depending on how you want to adjust grades.
- Calculate. The tool returns each curved score — and, for distribution-based methods, the matching letter grade — alongside the class mean and standard deviation.

What Does It Mean to Curve Grades?
To curve grades is to adjust raw scores rather than take them at face value. The reasons vary: an exam was unusually difficult, the class average came in low, or an instructor wants final grades to follow a particular shape. Curving shifts the conversation from absolute grading — where a fixed percentage always equals a fixed letter — to relative grading, where your grade depends partly on how the rest of the class performed.
Done well, a curve compensates for a flawed or brutal test and produces a fairer outcome. Done carelessly, it raises fairness questions of its own, which is why the method you choose matters as much as the decision to curve at all.
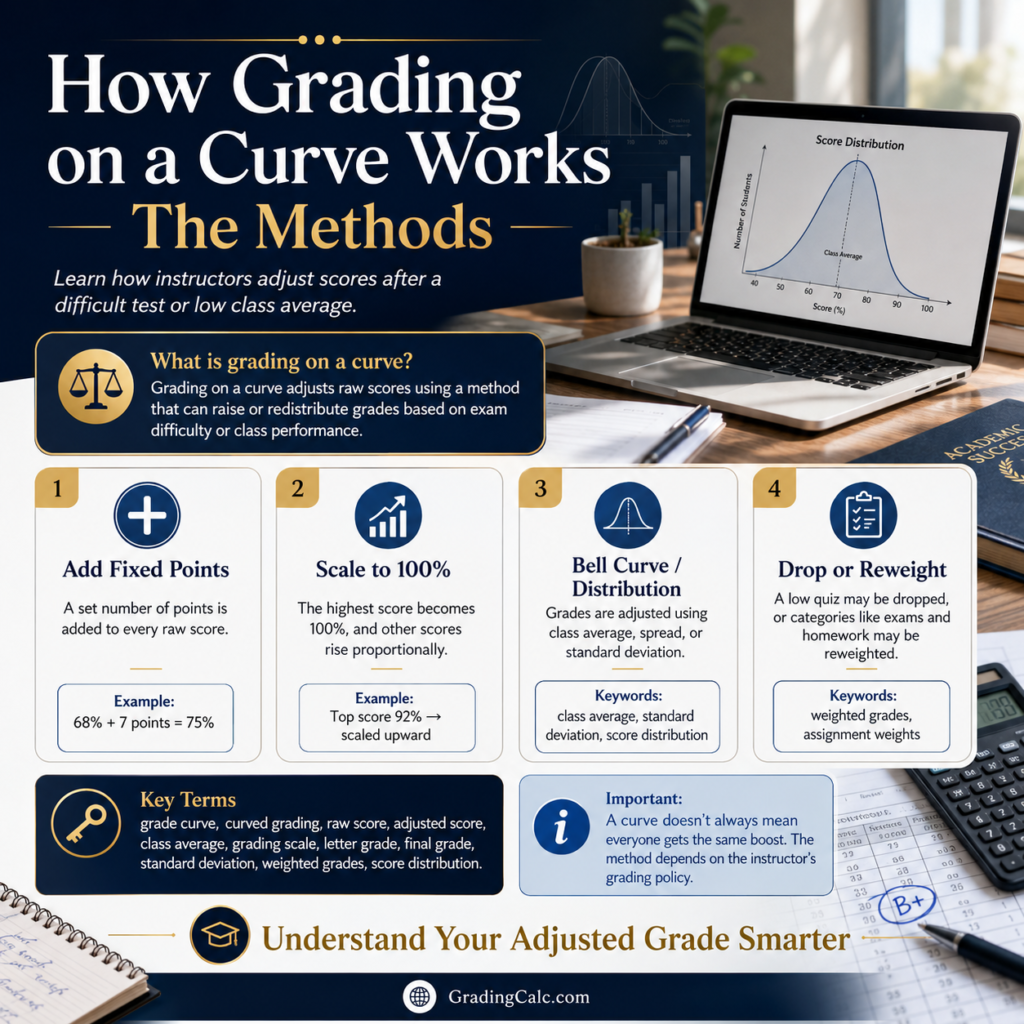
How Grading on a Curve Works: The Methods
There’s no single way to curve a grade. Each method below transforms a raw score differently, and the right one depends on whether you want to lift everyone evenly, stretch the top to 100%, or reshape the whole distribution.
Flat (Linear) Curve — Add Points
The simplest approach: add the same fixed number of points to every score. A common version sets the highest score to 100% by adding the gap between the top score and 100 to everyone. If the highest score in the class is 88, you add 12 points across the board, and a raw 75 becomes an 87. A flat curve preserves the spacing between students — everyone moves up by the same amount.
Proportional Scaling — Top Score to 100%
Instead of adding a constant, proportional scaling multiplies every score so the highest becomes 100%. With a top score of 88, the scale factor is 100 ÷ 88 ≈ 1.14, so a raw 75 scales to about 85. This stretches the entire range rather than shifting it, which means higher scorers gain more total points than lower scorers.
Bell Curve — Normal Distribution
A bell curve fits grades to a normal distribution centered on the class mean. The average score becomes a C, and letter grades are assigned by how many standard deviations a score sits above or below that mean — the further into the tails, the rarer the A or the F. With a class mean of 70 and a standard deviation of 10, a raw 75 is half a standard deviation above average and lands around a B−. This is the classic sense of “grading on a curve,” and also the most debated, because the strictest version forces a fixed distribution regardless of how well the class did overall.
Square Root Curve
The square root method recomputes each score as the square root of the raw score multiplied by 10 (for scores out of 100). A raw 75 becomes √75 × 10 ≈ 86.6. Because of the math, it boosts lower and middle scores far more than high ones: a 64 jumps to 80, while a 96 barely moves. It’s a popular choice when an instructor wants to rescue struggling students without inflating already-strong grades.
Standard Deviation (Z-Score) Method
The z-score method converts each raw score into a standard score — its distance from the mean measured in standard deviations — using the formula z = (score − mean) ÷ standard deviation. Those z-scores then map to letter grades by fixed bands. For a 75 with a mean of 70 and a standard deviation of 10, the z-score is +0.5. A typical mapping looks like this:
| Z-Score Range | Letter Grade |
|---|---|
| Above +1.5 | A |
| +0.5 to +1.5 | B |
| −0.5 to +0.5 | C |
| −1.5 to −0.5 | D |
| Below −1.5 | F |
A z-score of +0.5 sits right on the B/C boundary, so it rounds to roughly a B−. This method is the explicit, math-first cousin of the bell curve.
A handful of instructors also curve by percentile or rank — sorting students and assigning the top X% an A, the next Y% a B, and so on — but the methods above cover the great majority of real-world curves.
Worked Example: One Score, Five Curves
Here’s the same raw score run through each method, using a class top score of 88, a mean of 70, and a standard deviation of 10. Point-based methods return a new number; distribution-based methods return a letter band, which is the real difference between the two families.
| Curve Method | Result for a Raw 75 |
|---|---|
| Flat curve (top → 100) | 87 |
| Proportional scaling | ≈ 85 |
| Square root curve | ≈ 87 |
| Bell curve | ≈ B− |
| Z-score method | ≈ B− (z = +0.5) |
The takeaway: a flat or square root curve tends to give the biggest numerical lift here, while the distribution-based methods care less about the exact number and more about where the score ranks against the class.
The Statistics Behind a Curve
Most curves lean on a few core statistics. The mean (the class average) anchors distribution-based methods. The standard deviation measures how spread out the scores are — a small standard deviation means everyone clustered together, a large one means a wide grade distribution. The median and mode describe the center in other ways, and outliers or a heavy skew can pull the mean in a misleading direction, which is worth checking before you curve. The z-score and percentile then place an individual score within that distribution. If you want to dig into the underlying numbers, a standard deviation calculator or z-score calculator pairs naturally with this tool.
When Should You Curve Grades? Pros and Cons
Curving has a real upside. It compensates for a difficult test, smooths out a badly skewed distribution, and prevents a single flawed exam from tanking an otherwise capable class. When a test was genuinely too hard, a curve restores fairness.
The drawbacks are just as real. A forced distribution — where a set percentage must fail no matter what — pits students against one another and can punish a strong cohort. Aggressive curving also risks grade inflation, and it can quietly mask problems with the test or the teaching rather than fixing them. The honest middle ground is to treat curving as a correction for a specific, identifiable problem rather than a default applied to every assignment.
Curved Grades and Your Final Grade
A curved test score is rarely the whole story. That adjusted score usually flows into a weighted grade, where the exam counts for a set share of the course alongside quizzes, homework, and the final. From there it rolls into your semester grade and, eventually, your GPA. To see the full picture, a weighted grade calculator combines categories, a final grade calculator projects where you’ll end up, and a letter grade calculator converts the result back into a letter. The curve is one step in that larger chain.
Who Uses a Grade Curve Calculator
The tool serves both sides of the gradebook. Teachers and professors use it to scale a tough exam quickly and fairly, testing a flat curve against a square root curve before deciding. Students use it to estimate their curved grade once a method is announced. It’s equally at home in a high school classroom and a large college lecture course, where curving a difficult midterm or final is common practice.
Frequently Asked Questions
How do you curve grades?
Pick a method and apply it to every raw score. A flat curve adds a fixed number of points to all students; a square root curve recomputes each score as √score × 10; a bell curve assigns letter grades based on the class mean and standard deviation. A grade curve calculator runs whichever method you choose automatically.
How does grading on a curve work?
Grading on a curve adjusts scores relative to class performance instead of a fixed scale. In the bell-curve version, the average score becomes a C and grades are spread across a normal distribution, so your letter depends on how you ranked against everyone else.
What is a bell curve grade?
A bell curve grade is a letter assigned by where your score falls on a normal distribution around the class mean — the mean is a C, scores well above it earn A’s and B’s, and scores well below earn D’s and F’s.
How much does a curve raise your grade?
It depends entirely on the method and the class data. A flat curve that lifts the top score to 100% adds the same points to everyone, while a square root curve can raise a low score by 15 points or more but a high score by only a few. There’s no fixed amount.
How do you calculate a curved grade?
Apply the chosen formula to the raw score. For a flat curve, add the point gap to 100; for proportional scaling, multiply by 100 ÷ top score; for the z-score method, compute (score − mean) ÷ standard deviation and map the result to a letter.
What is the square root curve?
The square root curve sets your new score to the square root of your raw score times 10. It boosts lower and middle scores significantly while leaving high scores nearly unchanged — a 64 becomes an 80, but a 96 stays about a 98.
Is grading on a curve fair?
It can be. A curve is fairest when it corrects for a genuinely difficult or flawed test. It becomes less fair when a forced distribution requires a fixed number of low grades regardless of how well the class actually performed.
How do teachers curve grades?
Most teachers use a flat curve, proportional scaling, a square root curve, or a standard-deviation method, choosing based on whether they want to lift everyone evenly or reshape the overall grade distribution.